 Visualizing Data Simply
· 3 min read
dataviz.in turns 1!
This is the first anniversary of dataviz.in! Calls for a double celebration, having stayed sane so far through the Covid-19 pandemic. Learning how to showcase trends in data has certainly been a relief amidst the summer lockdown and rising case counts.
Today, I’ll deviate from the Covid-19 series of data vizzes that have marked my last few posts and instead indulge in some reminiscing. My first meaningful introduction to data visualization arose out of necessity, back in 2014. I had been working on some whole genome Next Generation Sequencing experiments and getting increasingly frustrated with my lack of bioinformatics skills to customize the analysis. And I could not find suitable tools to interactively explore my data and visualize it the way I wanted, that is, to display epigenetic marks on selected genes such that they could be searched and compared across datasets (cell types) - without using the command line.
Discussing the problem with my partner Saurabh and my colleague Tej over a cup of coffee led to the idea of developing our very own visualization tool. Here’s a mindmap of the flow of thoughts early in our plans 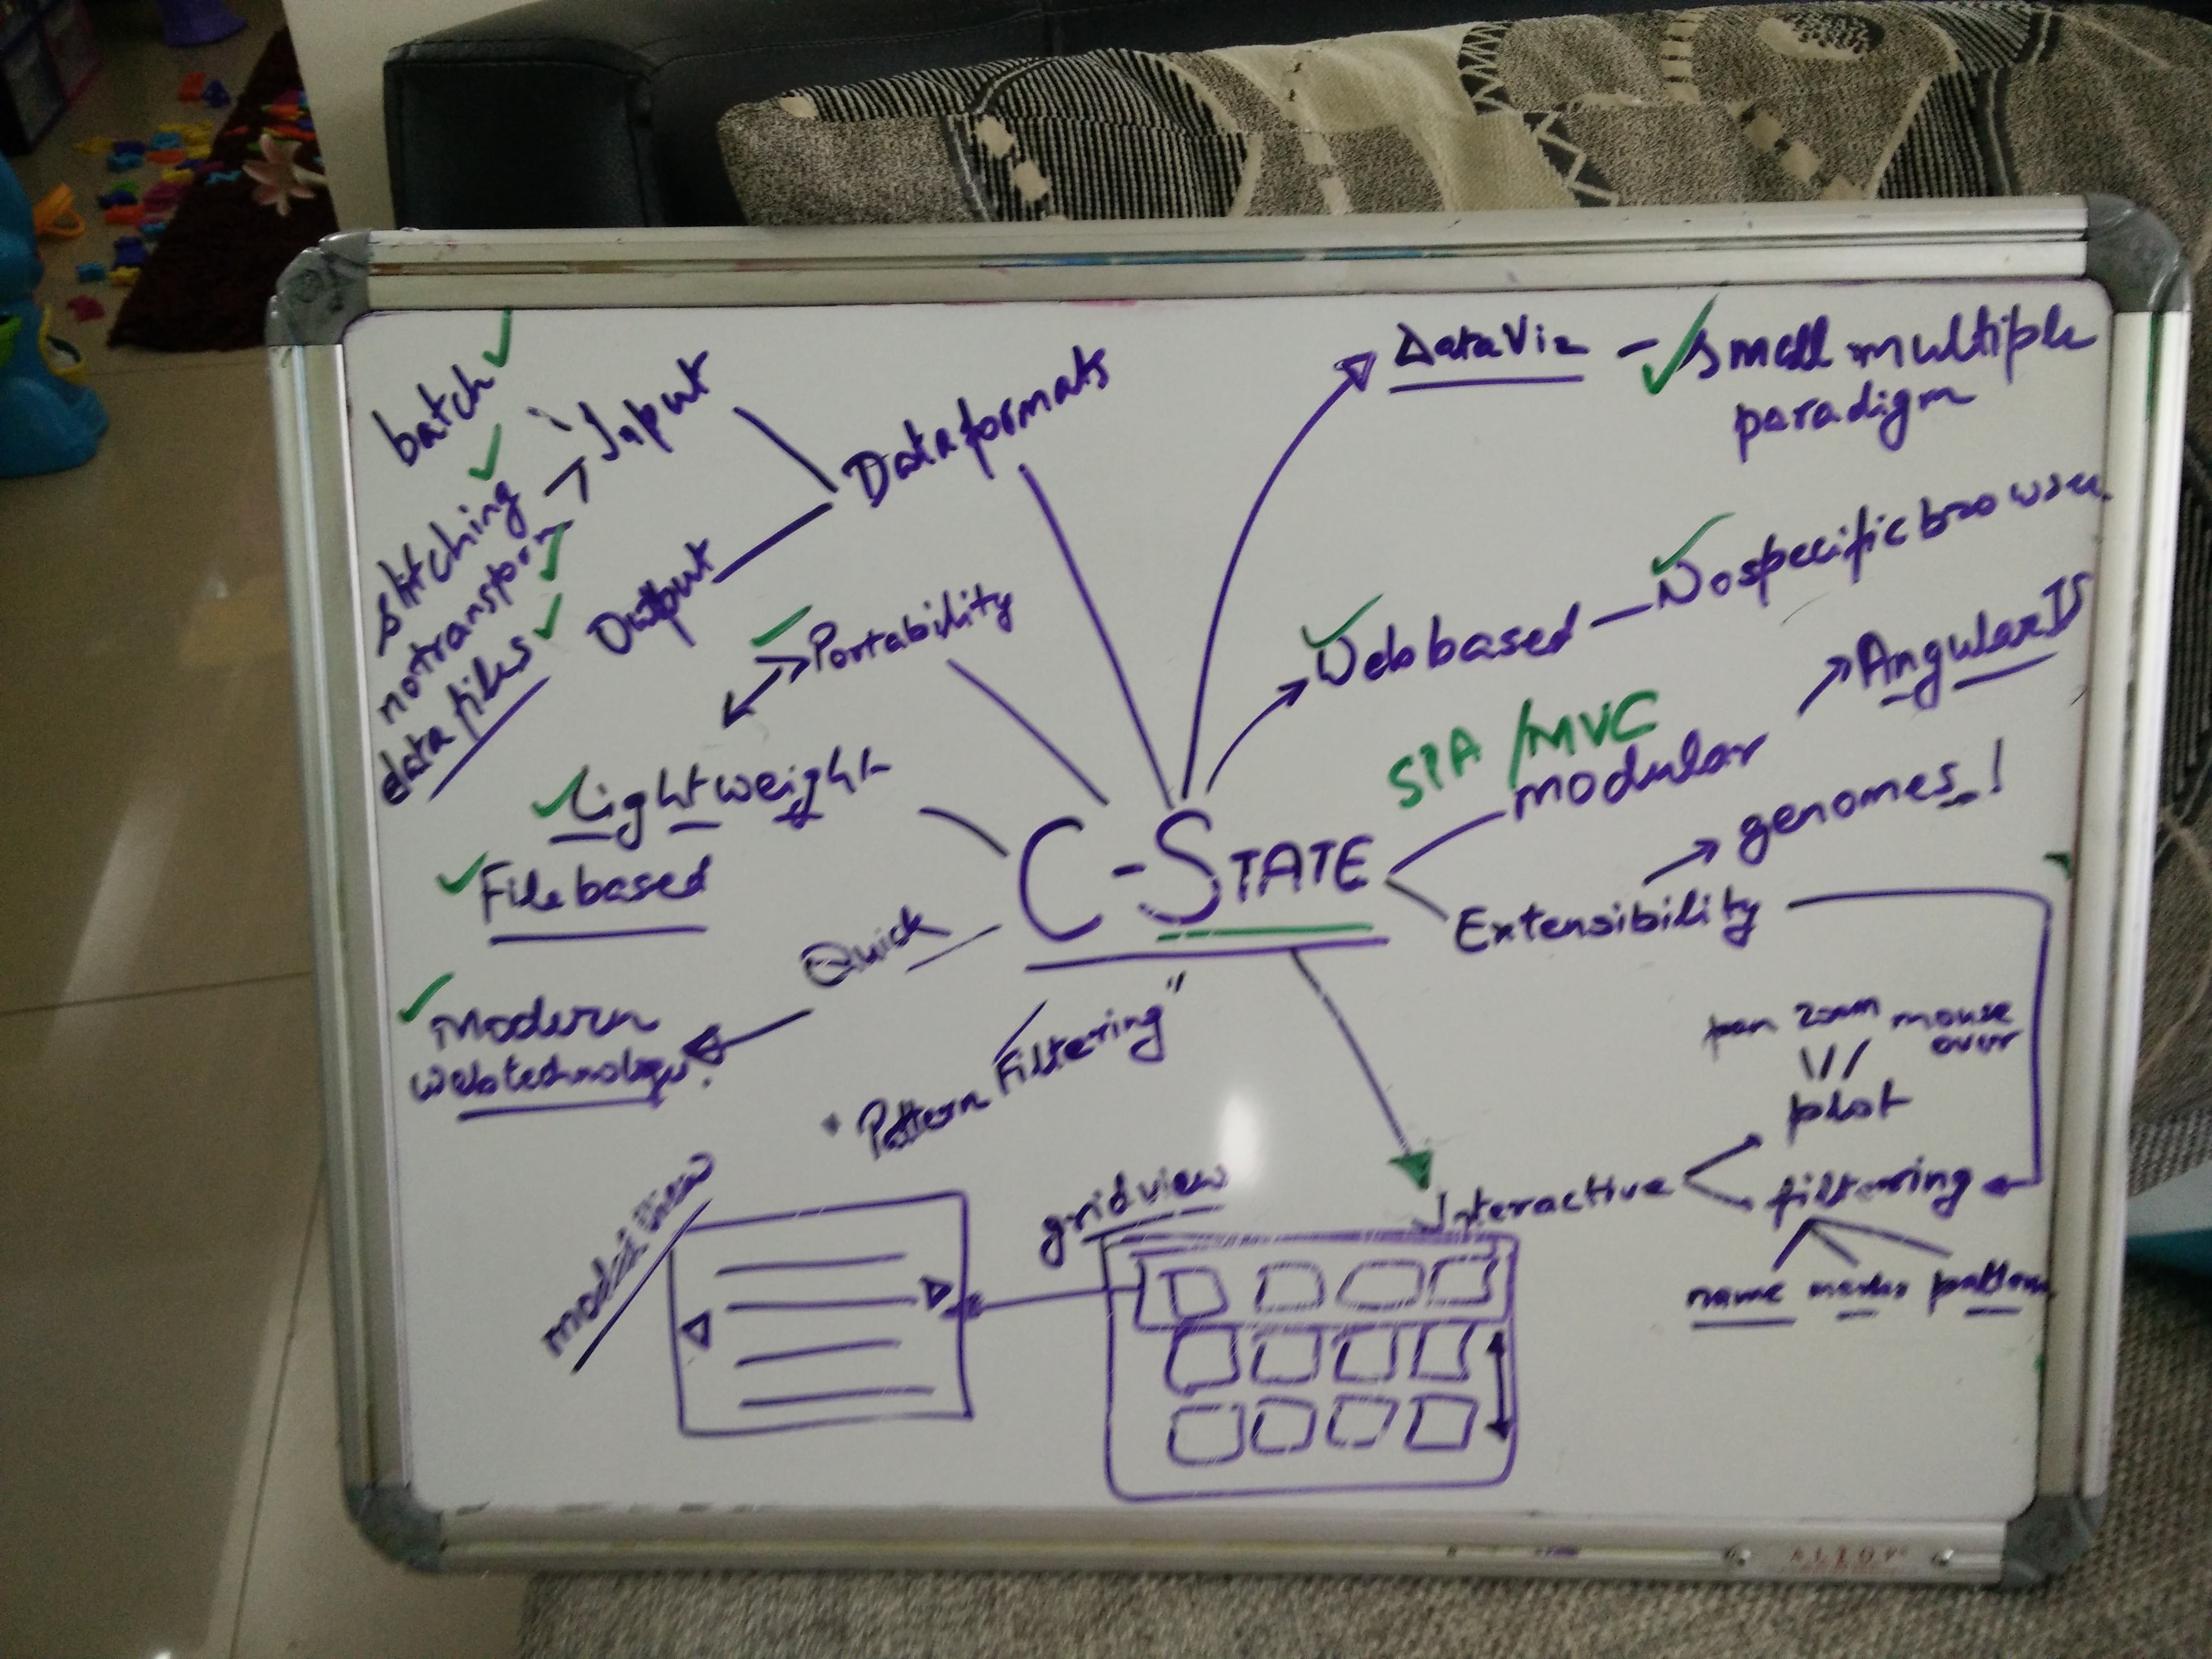
This was the first time I heard terms like ‘small multiples’ and ‘UI frameworks’. I realized I needed to learn some bioinformatics and programming basics from both these excellent and motivated tutors. It took a couple of years, one of them a long distance collaborative stint when I had to take a break and travel out of the country, but we finally succeeded in developing C-State for use in the lab.
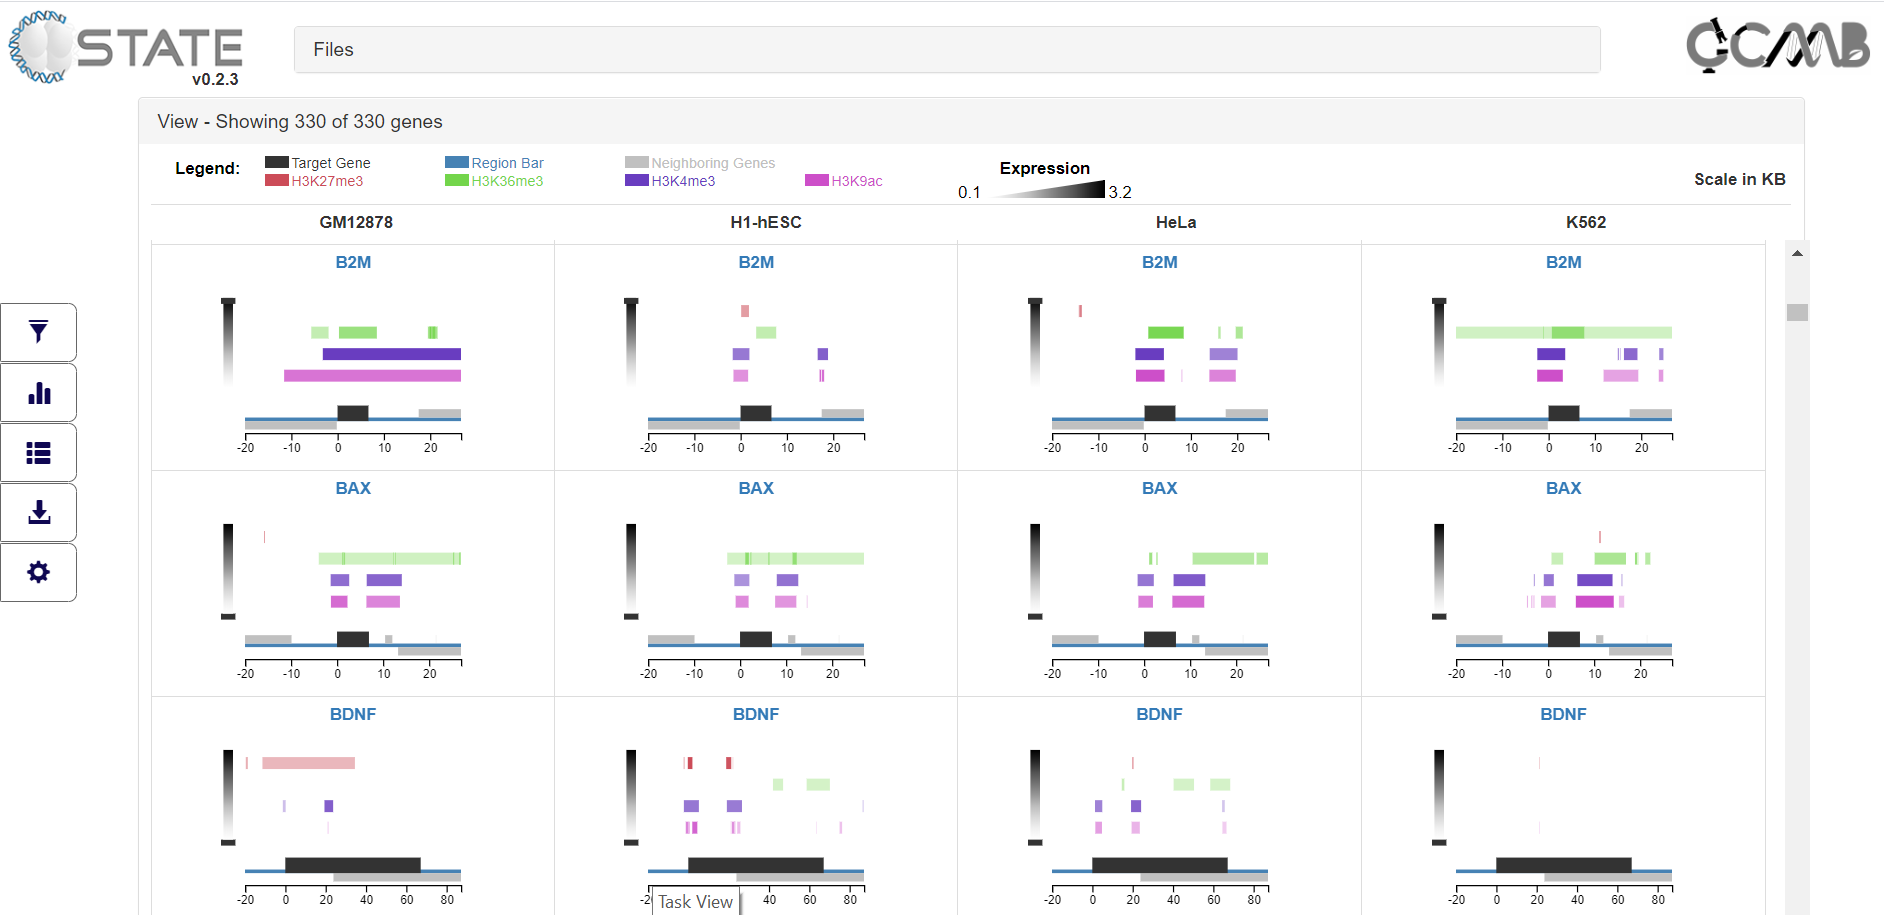
C-State solved my visualization problems and provided a GUI to interactively filter and compare epigenetic patterns.
The small multiples design allows users to visually scan many cell types or datasets and compare the state of marks on the genes across them. C-State further offers the ability to search for specific patterns (combinations of marks, genes and/or cell types) by chaining multiple filters, thereby enabling the user to develop complex queries on the datasets without writing code.
With encouragement from our mentors and many further refinements written in JavaScript using VueJS and d3.js courtesy Tej, we finally generalized the prototype enough to publish it. The acronym C-State (Chromatin State) was suggested by Jyotsna Dhawan when we kidded about now being able to ‘see’ the chromatin state of cells in multiple contexts and stages of differentiation. C-State is now set up as a web-app on the Rakesh K Mishra labpage for bench biologists who want to explore their epigenetic data without needing programming skills.
This journey marked a turning point for me, highlighting the mostly unharnessed power of data visualization for biologists. Over time, I shifted completely from the bench and put in a couple of years learning the ropes, and some code, before focusing my attention on data viz and its myriad complexities. As I enter my second year in this exciting field, I hope to continue sharing my learnings, and my vizzes, through this blog!
Do post your suggestions and comments on this thread!
A new look reaching the 1st anniversary milestone on my #biological #DataVisualization blog. https://t.co/qj9p5s7UT5. Been such wonderful learning for a #biologist, thx to the amazing #dataviz community and @DataVizSociety. Focus on #Tableau going ahead!
— Surabhi Srivastava (@SurabhiGS) July 28, 2020